The power of visual communication [infographic]
Posted by staff / May 2, 2014 infographicPowerPoint presentationpresentationvisual communication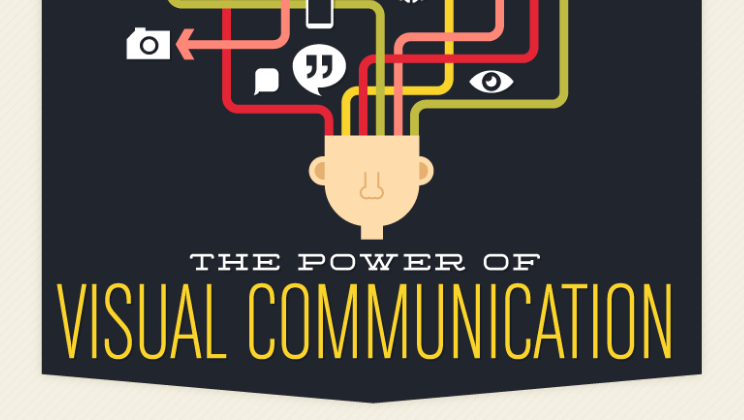
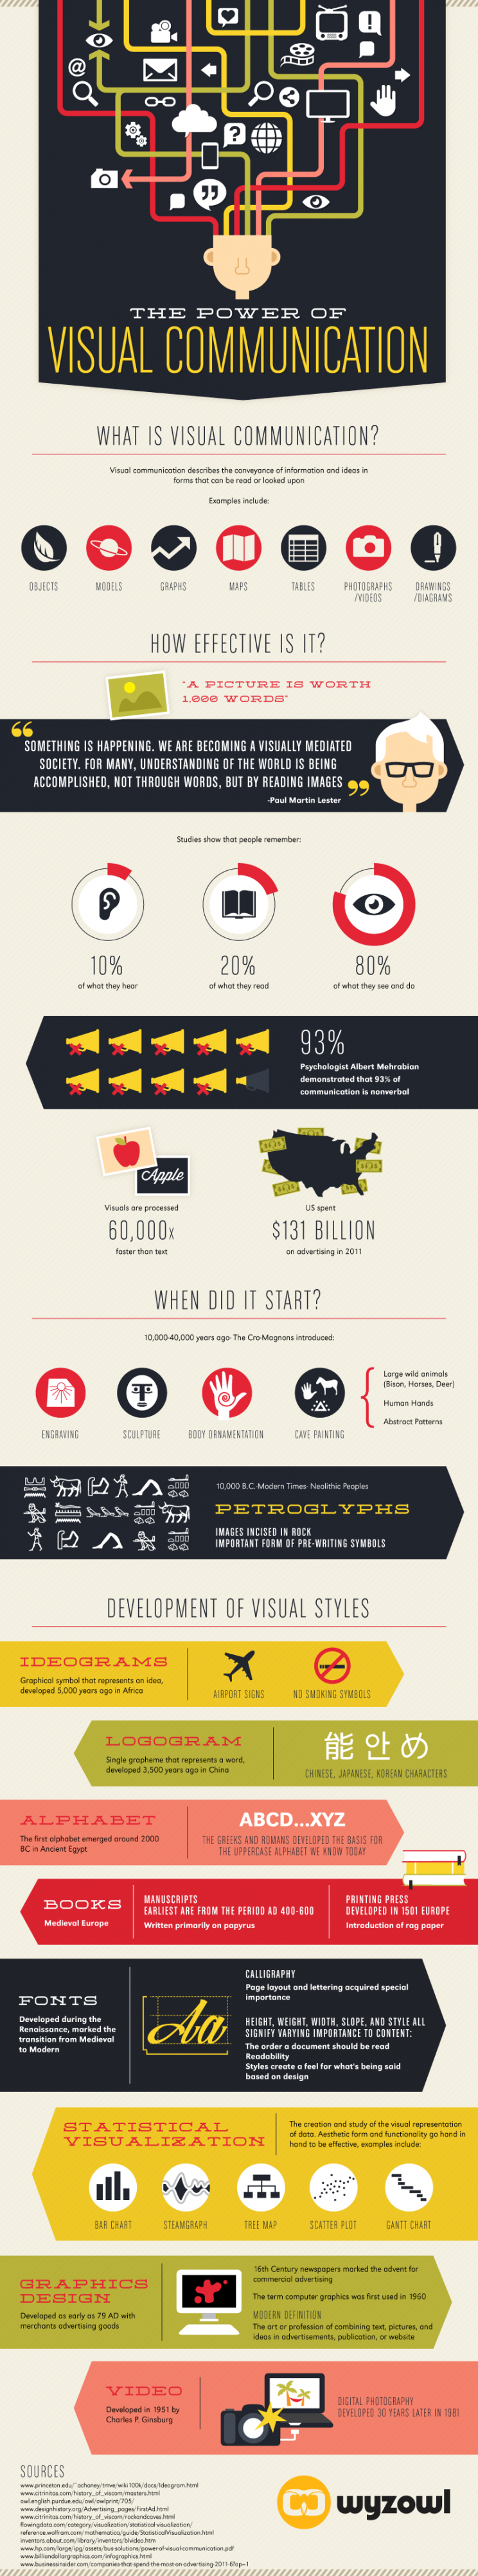
Long, long before the advent of the ever-present PowerPoint presentation, people were using images to portray and interpret the world around the them, and we have no doubt that more than a few Cro-Magnons were complaining about the tribal leader’s reliance on the same bison pictographs for every presentation.
Take a quick tour through the history of visual communication with this infographic from Wyzowl…then tweak those slides for more visual appeal, because our love of all things visual isn’t going away any time soon.
Via Wyzowl.
[…] Sign Pro Web likes Infographic on Visual Communications. […]
Great Job! Our mind works remember images and our eyes catch the goal of the messages with the data to share information in a public enviroment. I LOVE YOUR STAFF!!! It’s very professional and make an visual impact. Congratulations.
I think this is just a natural tendency and it will only continue to increase in importance as time goes by, one of the main differences between modern humans and its biological predecessors is the development of the areas of the brain dedicated to image processing, there is consensus about 20% of this vital organ is dedicated to this function, and up to 60% may be devoted to visual+some other function. I think the growing importance of visual comes from the fact that nowadays technology gives us more possibilities to present stunning visuals now, and the desire for beauty and function have been a constant in evolution since we can be called humans.
The 60kx speed factor is why the Visual is the artisan tool of the social age’s new discipline of Social Exerience Management. Maya Angelou said it best: People will forget what you said. People will forget what you did. But, people will never forget how you made them feel. Visuals are the fastest, most direct emotional feeds to the essential hunger, the forever thirst, for what make us human: Story.
It’s a “streamgraph,” not a “steamgraph.” Kinda undermines the whole “info” part of an infographic when it’s incorrect.
Great introduction to the growing use of infographics!