The difference between Use-By, Sell-By, & Best-By [infographic]
Posted by staff / May 1, 2015
One big contributing factor to the massive amount of food waste is confusion over date labels.
Read MoreThe intersection of healthcare & computer science [infographic]
Posted by staff / April 25, 2015
While we’ve heard plenty about the computerization of medical records, what you might not have realized is how many other ways computer science is making the field of medicine more efficient than ever before.
Read MoreHow to recognize employees who rock [infographic]
Posted by staff / April 17, 2015
It takes a lot of time and effort to train new staff, so making sure top employees are recognized for their worth is a major responsibility of management sure to pay off in the long run.
Read MoreHow social media is affecting our mental health [infographic]
Posted by staff / April 14, 2015
Is social media driving you crazy or filling a void in your soul?
Read MoreGame of Thrones character relationship map [interactive infographic]
Posted by staff / April 13, 2015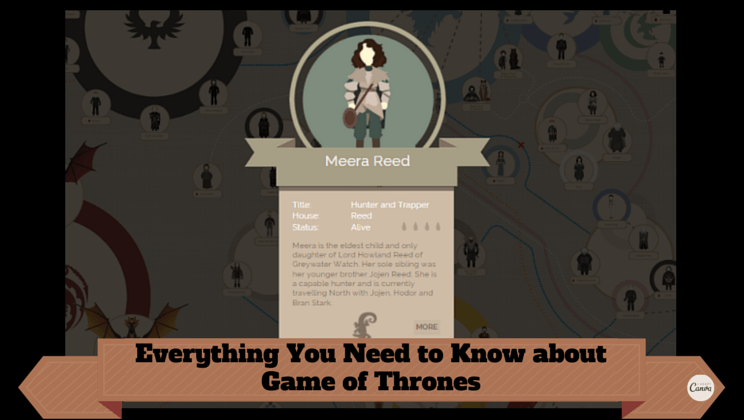
Love “Game of Thrones” but keep getting all the character connections confused? Sick of trying to explain what’s going on to the friend who never pays close enough attention?
No worries with this Game of Thrones character relationship map, the fun way to figure out what’s going on without having to ask embarrassing questions.
Read More11 killer tips to stop saying “um” forever [infographic]
Posted by staff / March 25, 2015
Few things are more annoying to an audience than being held captive by a speaker who can’t control there “Um”s and “Er”s, so to stop this presentation tic in its tracks, take a few tips from this helpful infographic from the London Speaker Bureau.
Read MoreUber & Lyft: the taxi industry’s worst nightmare [infographic]
Posted by staff / March 11, 2015
If you haven’t personally taken Uber or Lyft, you probably know someone who has.
What you might have wondered while grabbing this relatively new form of transportation is how it’s impacting the traditional taxi industry, and the answer is big time.
Read MoreThe 6 principles of design [infographic]
Posted by staff / March 1, 2015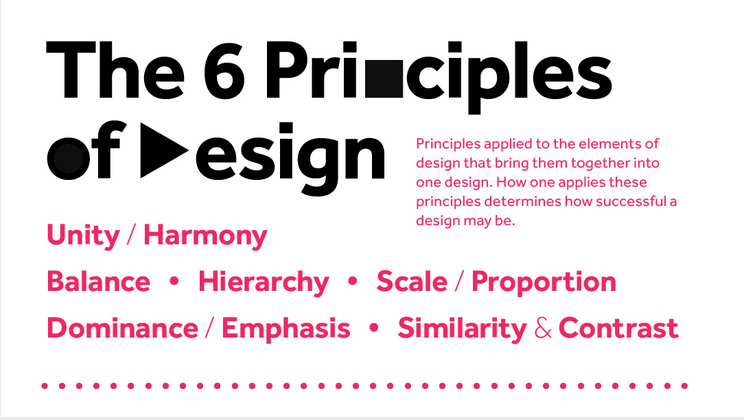
Making a splash on social media these days is all about the visuals, so more and more people are diving into design of the do-it-yourself variety.
Read More5 types of toxic employees and how to deal with them [infographic]
Posted by staff / February 26, 2015
Toxic people in your personal life can drain your energy, but toxic individuals at a company can cause a dip in employee morale and productivity, putting a price on that negativity that managers have to deal with before serious damage is done.
Read MoreHow to name your company [infographic]
Posted by staff / February 22, 2015
What’s in a name?
More than you think when it comes to ensuring a business’ success, because the last thing you want to do if you’re going into an international market is to accidentally call yourself the equivalent of “crap.”
Read MoreThe definitive guide to influencing people over the phone [infographic]
Posted by staff / January 2, 2015
Digital communication is all the rage, yet the need for good, old-fashioned phone expertise is still necessary in many facets of today’s job market and not knowing the ins and outs of conducting winning conversations could cost you a sale, a client, or a job faster than you can say “Hold, please.”
Read MoreKnots every outdoors-person should know [infographic]
Posted by Josh Taylor / December 28, 2014
Need to tie a knot? There’s an app for that! Wait, no! There’s no app for that! But with this infographic you can tie all sorts of speciality knots with no trouble at all.
Read More